On Review, Bubble Persists…
After doing a lot of review of data and charts over the weekend I have to say that the magnitude of the bubble that we were in and the leadup to it (39 years and a hyper last 10 years) will require a much bigger pin to burst it.
Trading Positions
I feel fortunate that using some of our short-term triggers we exited all our short positions last week and am now modestly long in some trading positions. Note I said LONG, not BULLISH.
Some Charts and Analysis Next..
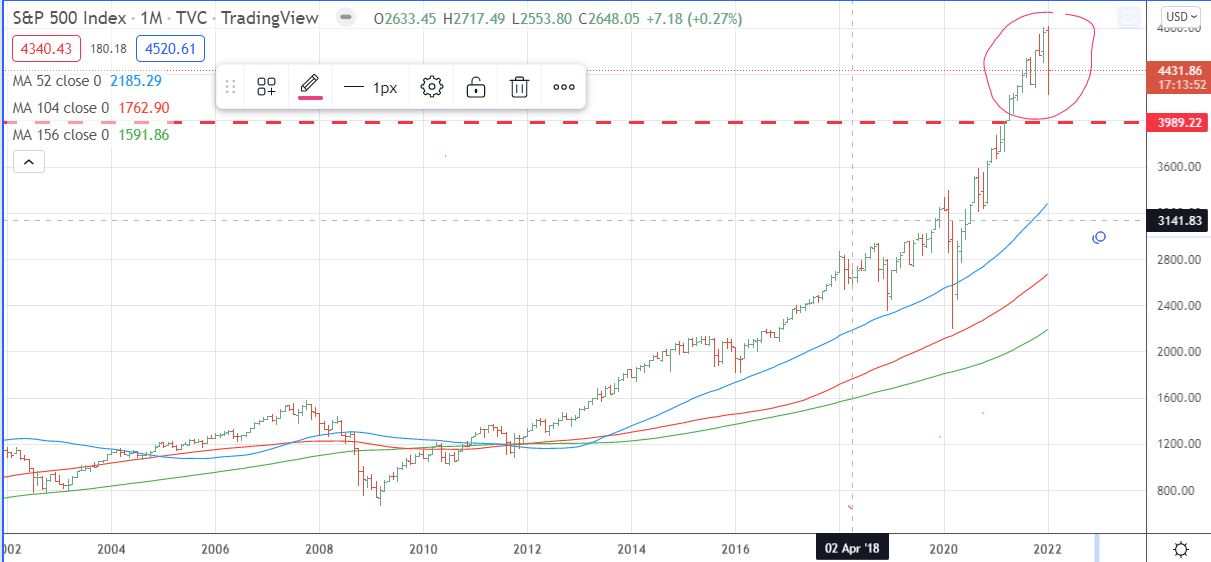
Here is a chart using monthly data that encompasses the period 2003 to present. The last period of the 39-year runup. I have drawn a red line around the area that I view as the Bubble portion which started back in April 2021.
Next here are three daily charts that each provide viewing the interaction of three moving averages, a 52-day, a 104-day, and a 156-day. From these you can see the differences between the 2007, 2020, and 2022 Top areas.

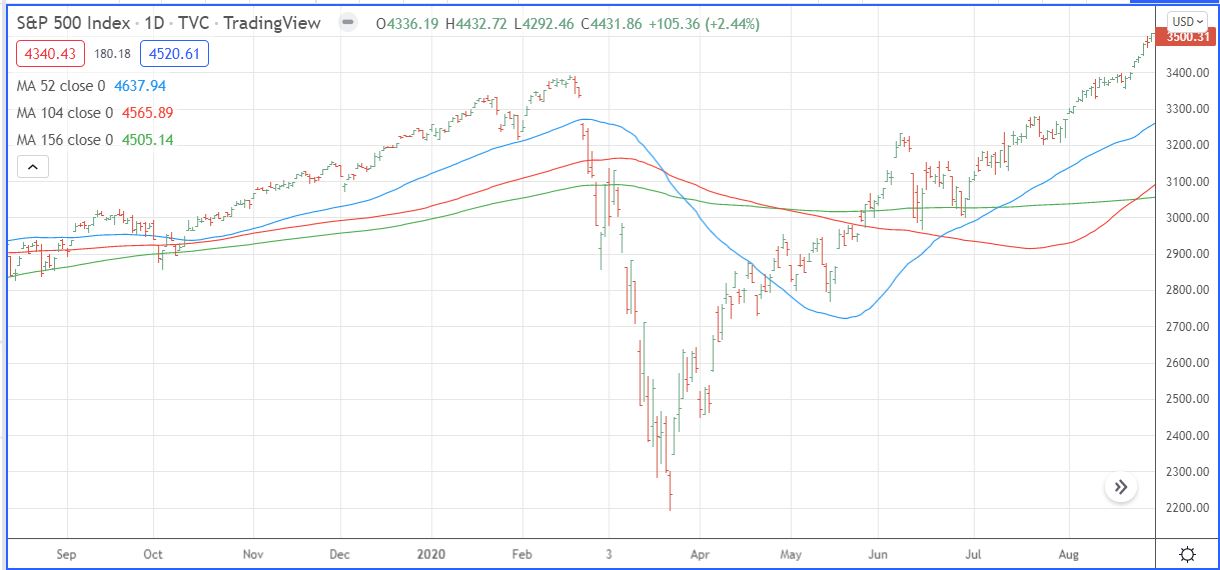
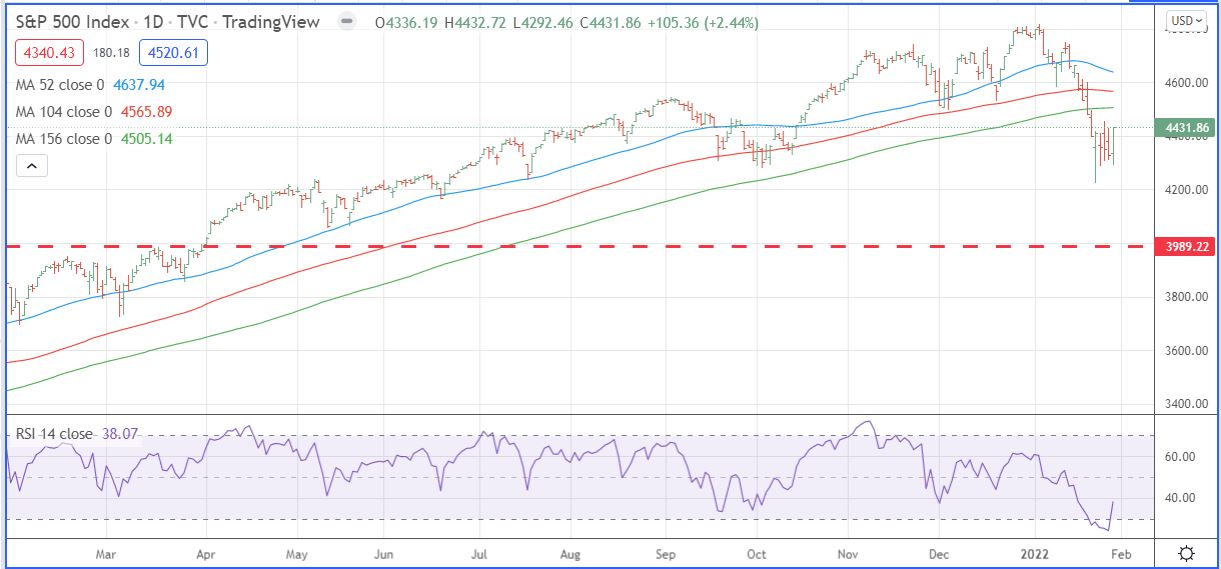
It should be apparent that the recent topping action for the 2022 chart does not appear to be over.
What is my Thinking?
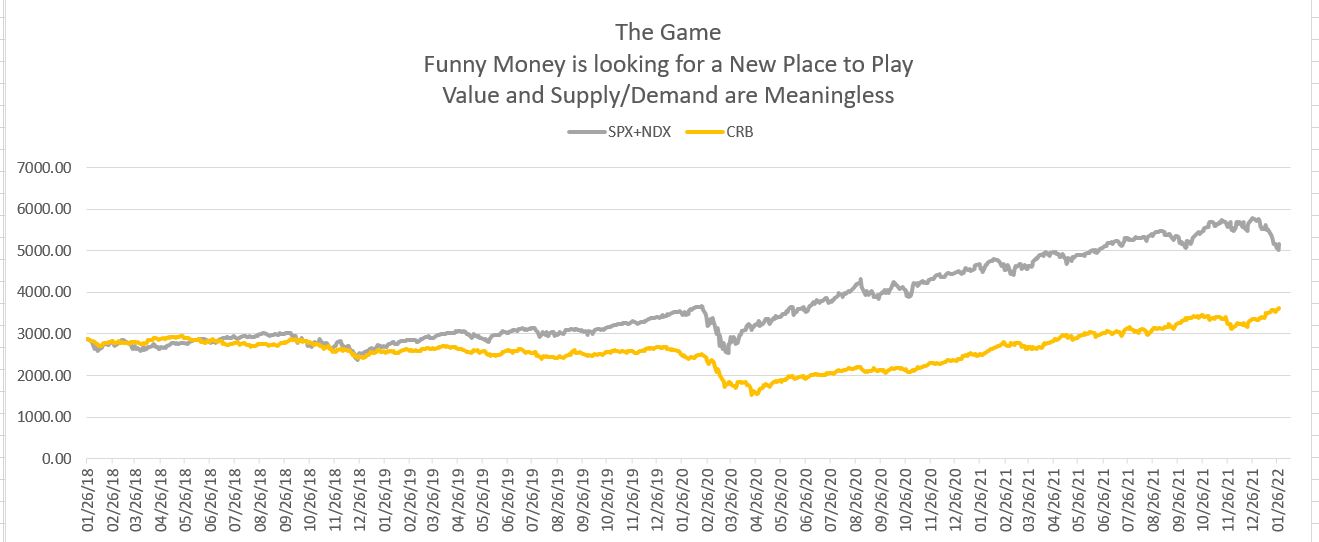
First, I view the recent action of Powell’s Federal Reserve to be inadequate in curbing inflation and may actually be increasing long term inflationary factors by not reducing the Fed Balance sheet. What to me appears as just a lot of Fed talk and which in effect does not reduce Funny Money, but just moves it around. See charts here of the S&P-NDX value index compared to the CRB commodity index. It is apparent that money moved out of stocks into commodities over the past few weeks. Next, we will probably see a lot of it come back into stocks for another run at the highs.
Leave a Reply