Hammerhead Top
There is a lot that points to this being an important point in the 40 year supply side inequality play. See the following two charts.
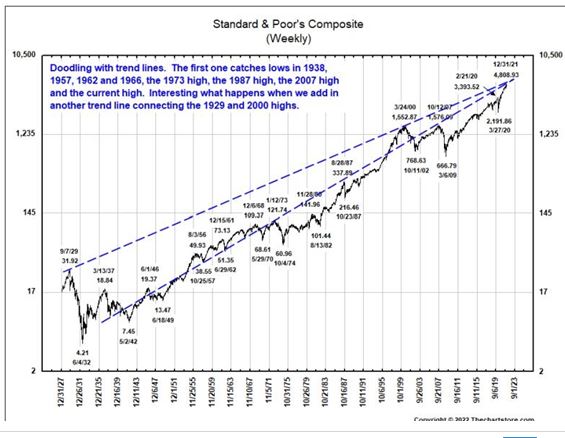
The Chart here is from my good friend Ron Griess at Thechartstore. It shows the massive buildup into this final stage of the top.
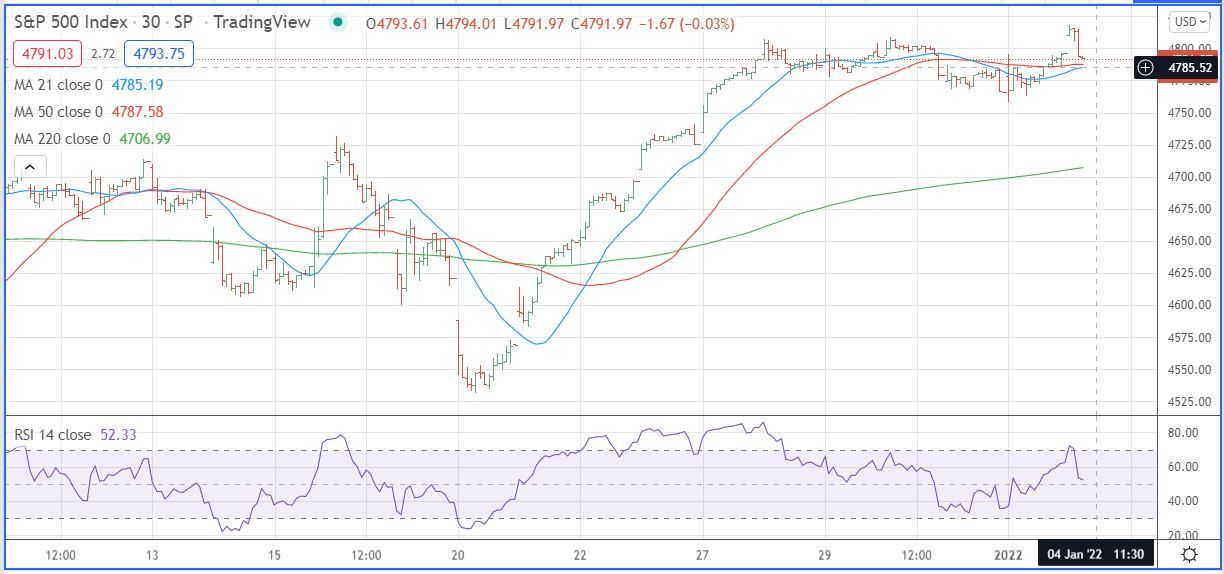
The next chart shows the short term aspects of the hammerhead stall. Chart uses 30 minute bars. This chart was made at 10:00 AM CST today, after the S&P market stalled out after making a new all time high. For the moment the Dow Jones 30 Industrials are still in new high ground, but I look at this small index as just a trojan horse.
Leave a Reply