Signal Loss
After ten years of artificial markets based on artificial economics signaled by Fed Chair Ben Bernanke in the Fall of 2011 with QE2, the markets don’t have a real solid direction. Recent market action, especially over the past few days show that the huge difference between inflation and deflation is not clear to the markets or its players.
S&P Long-Short Hedge Trade Model Review
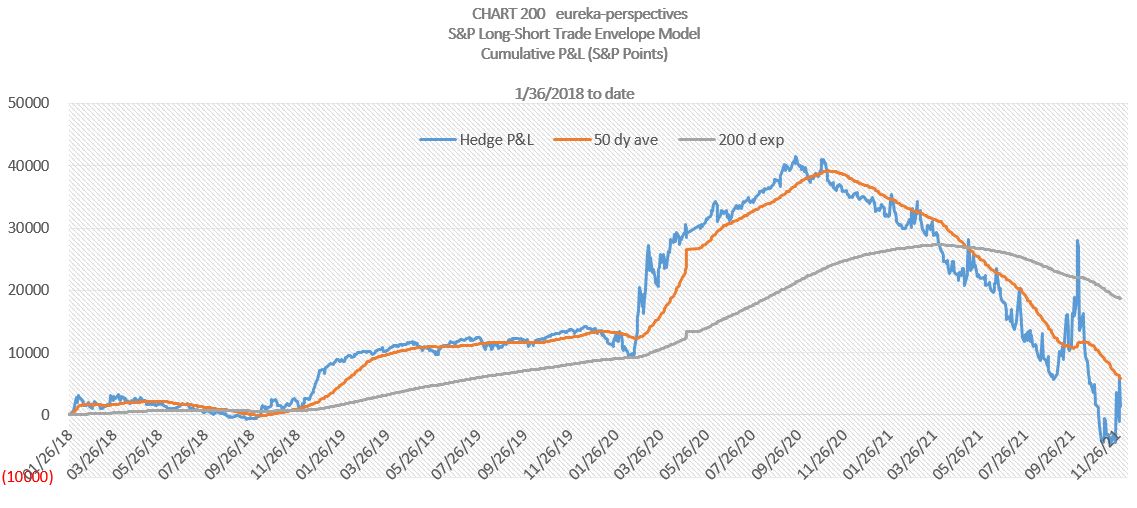
For those of you who have been following our S&P Long Short signal Model since we implemented it in January 2018 (as it appeared that government fiscal policy (through corporate tax cuts was piling on top of FED activity) here below is the output chart updated through today.
This Model is based on two algo’s that calculate the edges of a valuation envelope, a buy edge on the bottom, and a sell edge on the top. It should be evident that the Model did well with returns (2 Long and 2 short trades) piling up between January 2018 and the high period of 9/25/20 to 10/28/20. Since then returns steadily declined into the recent low of 11/18/21. If you look back into the archives you will note that the model was short before the Covid crash in February 2020 and reversed to Long in early March 2020. The current short signal was instituted on 8/27/20 and has continued for some 15 months.
You will recall that this model is based on S&P points with 10 units at the inception of a trade signal and with a long signal the addition of one unit each day the 14 day RSI is below 33.0 and for a short signal, the addition of one unit each day the RSI is over 66.0.
I use this model to provide an anchor with discipline to appreciate the effects of artificial inputs. For me personally this is my check against overthinking the market by following the FED.
You will note that some big changes to the chart direction have occurred since 10/6/21, but moving averages still have a negative direction.
Leave a Reply