Inflation is the Key to 2022
For the past two years the value of subtle factor market analysis has waned. This was due to the fact that the FED and its balance sheet has been the whole game. Now we are starting to see shades of the problems that effort has set up.
Conclusion, Long term interest rate risk are in focus..
So far markets are looking at short term rates going up, which is the sector the Fed has control of, but I think the real risk is when long rates take a deep look at inflation risks.
Below are three charts I look at for a signal on long rate direction. They are for three levels of data, daily, weekly, and monthly. These charts show the differential index between a long Bond ETF TLT and a leveraged short Bond ETF TBT. This analysis tends to amplify the long term interest rate signal.
Today the daily chart is showing a breakout.
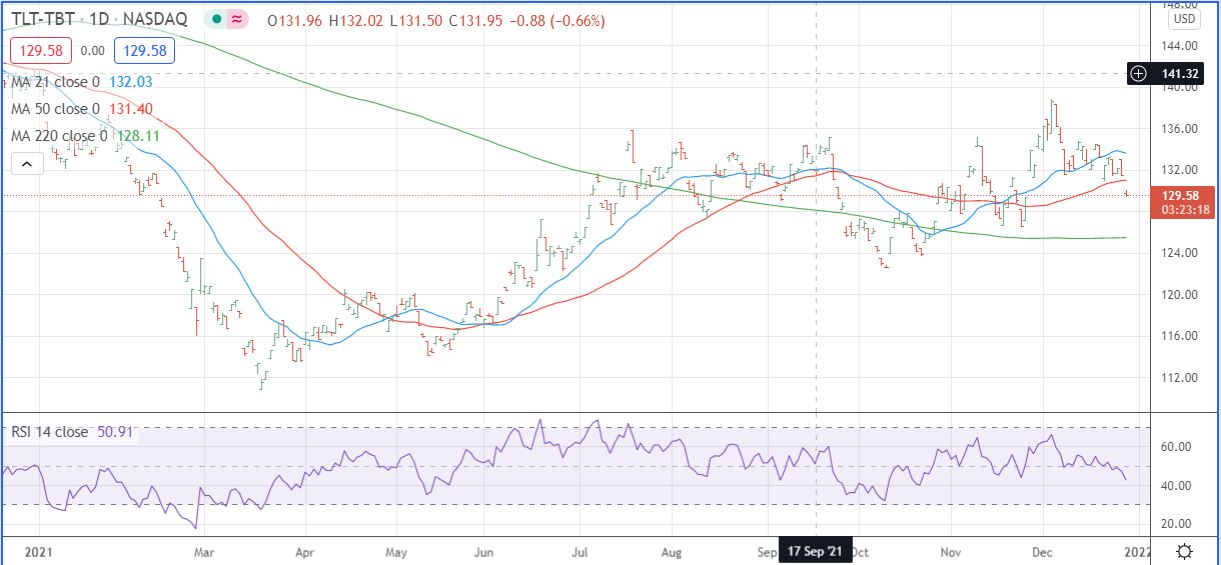
The next chart is the weekly version.
This chart is good at showing the short term rise of T-Bond prices from March of this year, the point at which problems of the stock Bubble started to show its face.

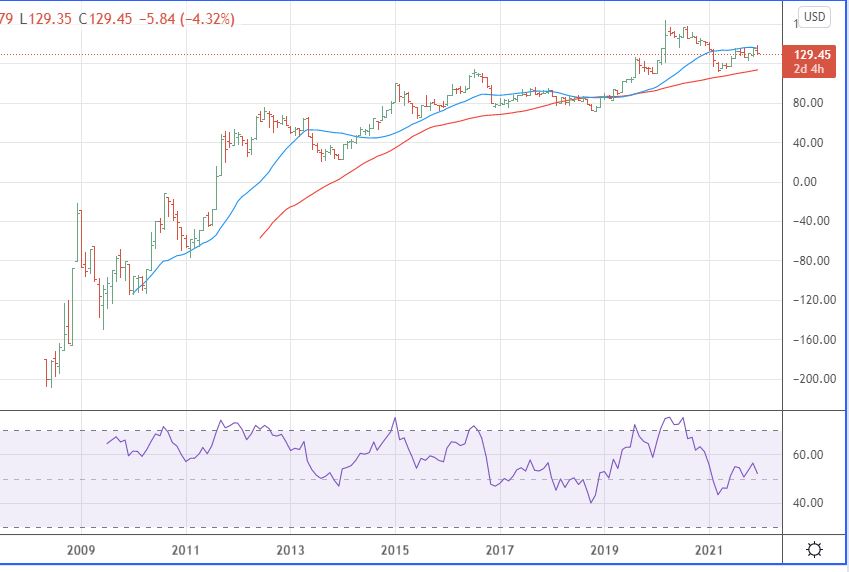
And lastly the monthly data chart..
Here you can see the pattern over the past 12 years and the top on bond prices as long term interest rates start to adjust.
Leave a Reply