CPI, Bad Number, but no Surprise
So, we move the chess pieces around the board while awaiting the FED meeting.
The larger background piece is the much talked about supply bottlenecks which are really the result of manufacturers and suppliers building huge inventories for the much awaited New Normal. This is pushing up GDP but will be a big headwind on first quarter corporate earnings.
In the bigger picture down the road we probably will at some point need to forget the Fed Funds rate. The embedded inflation problem is going to be so difficult to get under control that the possibility exists maybe half of the 4 trillion dollar Fed bond buy over the past two years will have to be dumped. This will be an extraordinary reaction to an extraordinary event. Something that never really has happened.
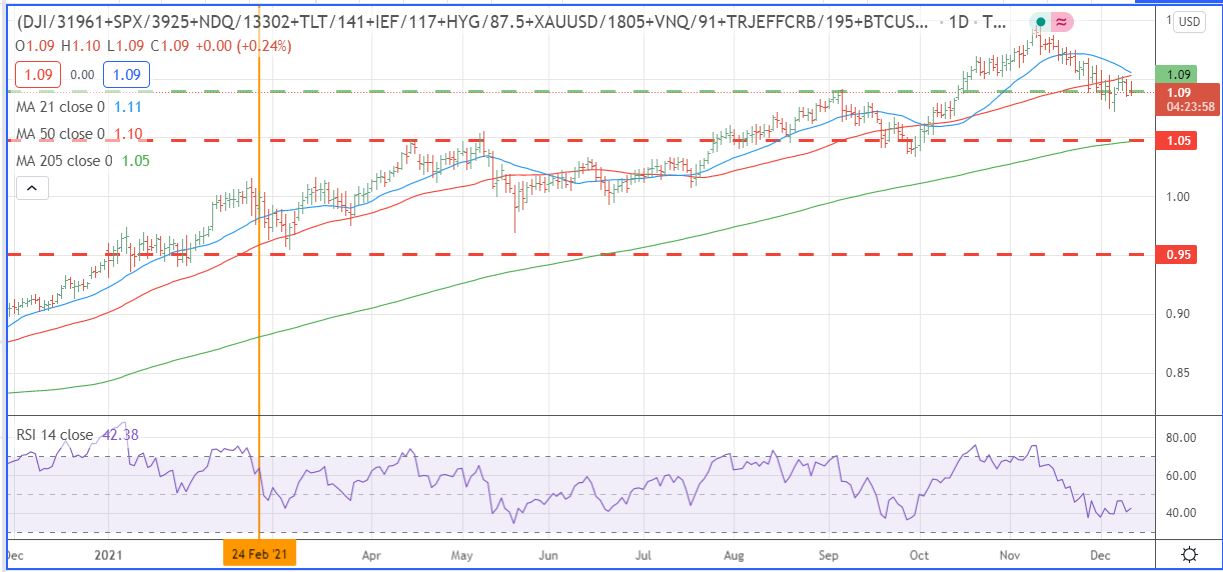
Taking a Look at the Big Picture Chart, (10:30 AM CST)
Here is the index I follow, an index based on stocks, bonds, gold, commodities, real estate, and bitcoin. It provides a picture of overall trading assets, probably a reflection of the FED balance sheet plus leverage. What this chart shows is the period between when the Culmination Bubble started on February 24, 2021 through today, around 200 days. The top on this chart occurred on November 8, 2021 yet the important 50 day average is still pointed higher. Even though the market is trading below that average the market is hanging. Consequently, overall trading assets are receding, usually a step before a plunge.
Leave a Reply