Lots of Bounce
Ten years of Funny Money, starting with Bernanke’s FED QE2 in October 2011, provide lots of bounce activity to the markets but do not negate what is evolving.
Today we are seeing kind of a test of some solid moving averages, again the direction of the 50 day is key, and for the majority of sectors has rolled over since the September 7 composite highs, whether the market is above or below the average is only a trading opportunity. The Bubble is imploding.
Bottom line is that the FED does not have basket of goodies to handle the situation that is evolving.
- Inflation is becoming embedded in terms of inputs, both people costs and raw materials.
- The Supply Chain story is real and in a way provides a good excuse for anyone forecasting a robust economy going forward. It may be that the consumer has changed, COVID has changed priorities, retail demand may disappoint going forward.
- And a key factor, “The People’s Behavior, Stupid”, is what counts for a return to a new normal. We are not close with 43 % of the population unvaccinated.
Here are some charts from 1:00 PB CDT today,
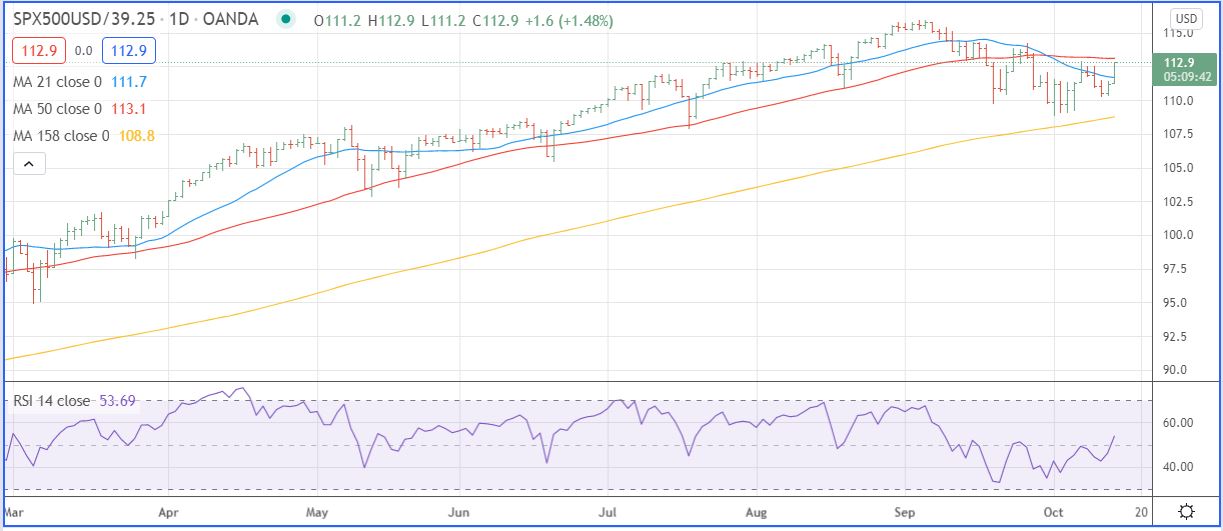

- The first chart is for the S&P using our index that clearly shows the 50 day average is headed down and is being tested today.
- The second chart is for the S&P divided by the 10 year bond yield, which show even more deterioration.
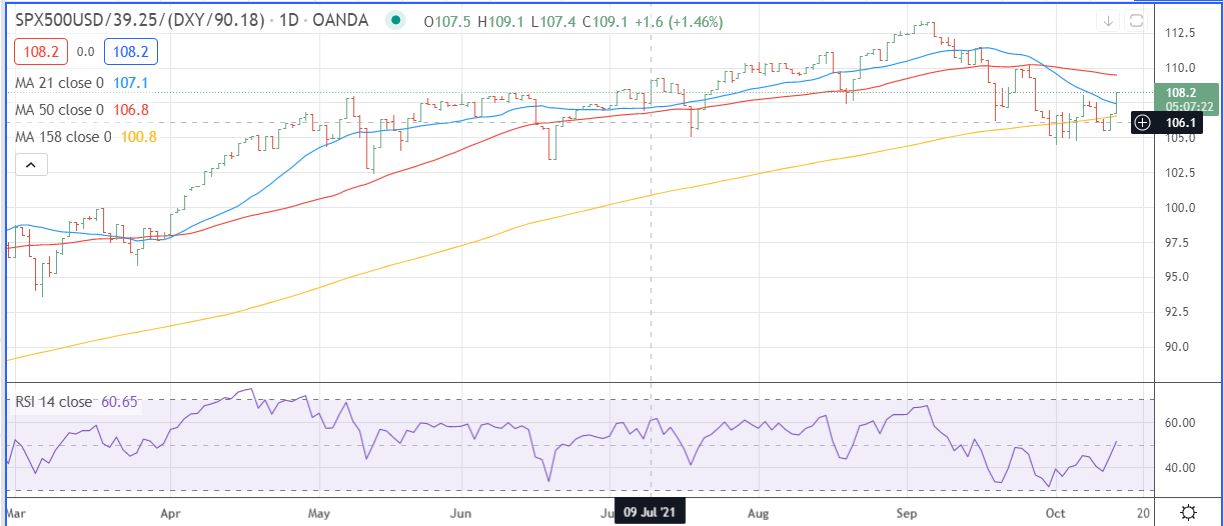
- The third chart is for the S&P divided by the dollar currency DXY. Same conclusion.
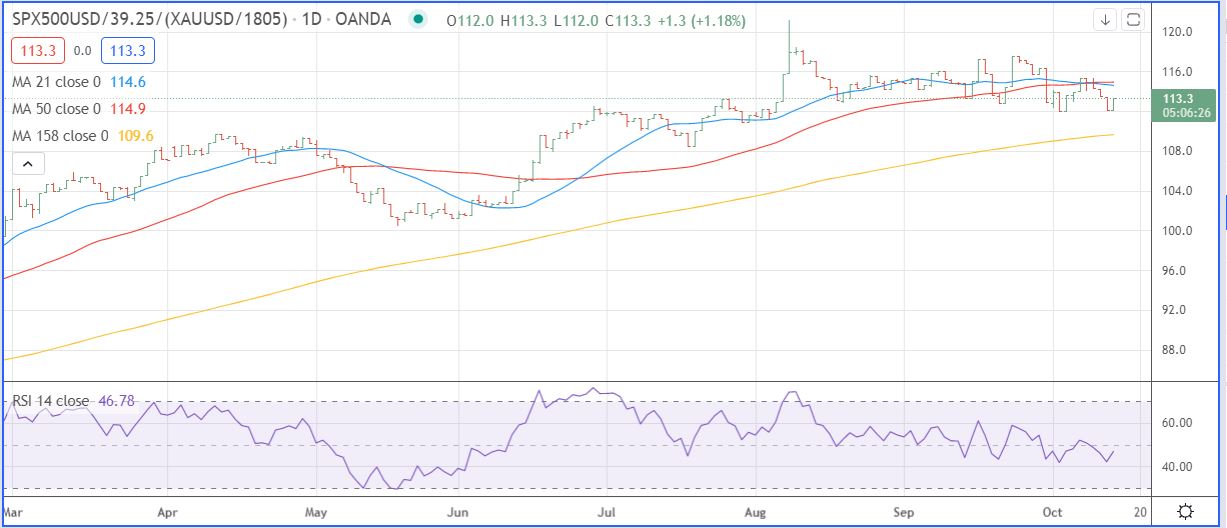
- The fourth chart is for the S&P divided by gold, kind of the last nail in the coffin.
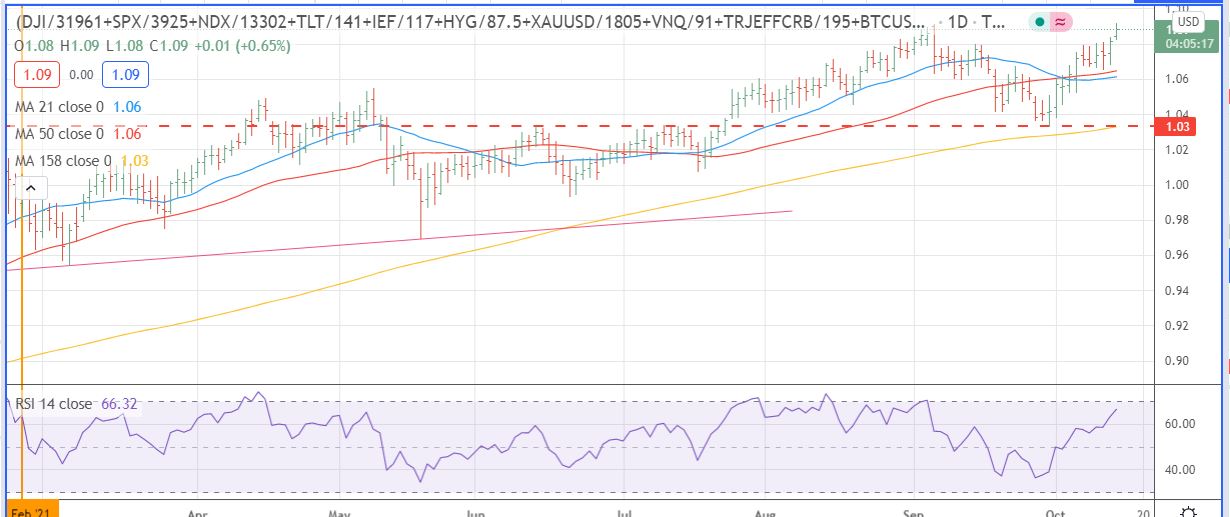
- And the fifth chart takes a look at the whole market, stocks, bonds, gold, commodities, and bitcoin, (unadjusted). This chart allows one to see the raw effect of all the funny money. It is testing the Sept 7 highs today.
Leave a Reply