What Could go Wrong ?
For a bit of Saturday morning reading please take a look at the Home page listing for “What Could go Wrong? by John Mauldin. It outlines a number of items pertinent to the market at this point.
A little backstop info:
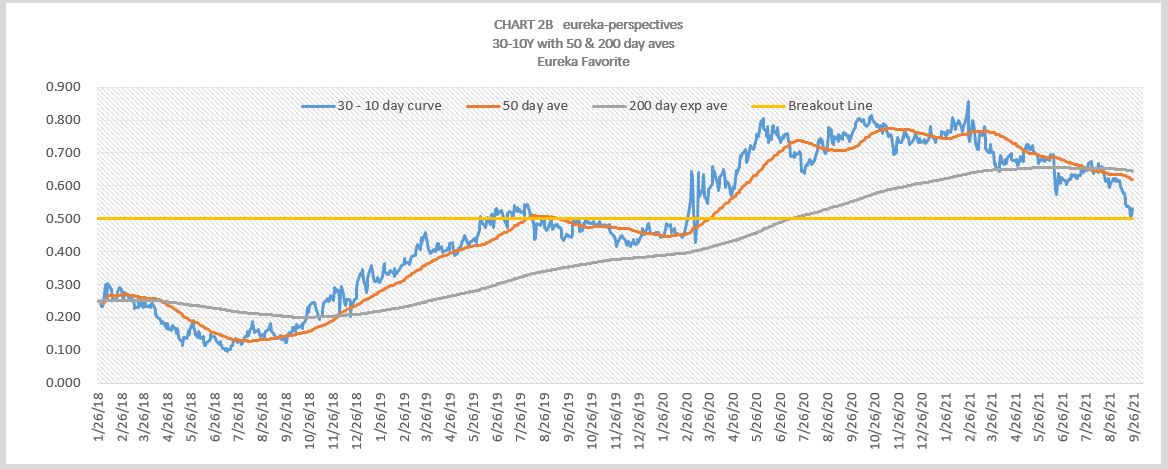
Here is a chart of the 30-10 year yield curve and its test this past week of the 2/26/20 breakout, the curve came all the way back to its starting point. What I would view as the end of Powell’s Transitory inflation talk.
Leave a Reply