Fangs / 10yr rates
As all the factors intermingle within the asset bubble, one thing that needs to be monitored is the aggregate value index of the Fang stocks versus the working 10 year interest rate.
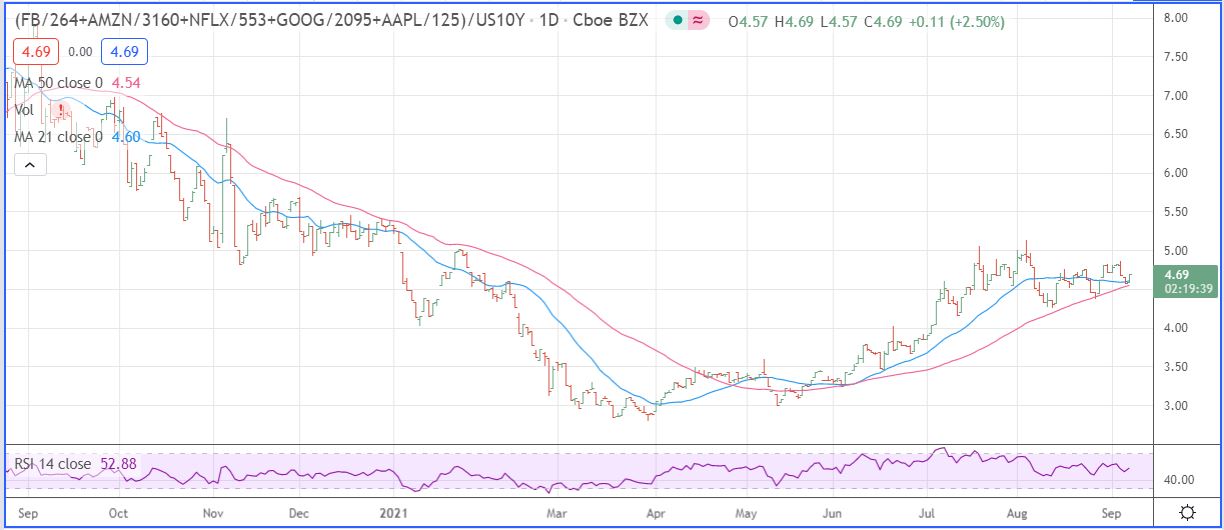
Here is the chart we watch in terms of that relationship component. It takes the FANG index and divides it by the 10 year interest rate. We have added 21 day and 50 day moving averages to complete the picture. This relationship is important as traders and investors seem to hide in the FANG stocks when the market gets nervous. Since we believe that embedded inflation factors have a high probability of being part of what pierces the bubble and combine that with the asset index where everyone hides, you get a picture of the fracture point.
You can see that back on June 3, 2021 the relationship tested the 50 day average. At that point the 10 year interest rate was 1.628 and the price of the FANG index was 1.05. Since then as the reopening play stalled, interest rates dropped to 1.340 currently and the FANG index rose and is currently 1.250.
That puts the chart value at 4.69 at the moment (1:00 PM CDT). The Beige Book was just released for the month and it talked a lot about COVID and the Delta variant and how that may effect consumer demand. The real question is why the FED still is putting money in an area that doesn’t solve any of these problems. And we will be watching to see what the ECB does on stimulus tomorrow.
Bottom line, what we are watching for in this chart value is when it will see a decline below 4.25.
Leave a Reply