An Analysis of Where we ARE
Today’s employment is history.
My view is that the Next Depression has already started, look to West Virginia and Kentucky, thanks to Joe Manchin’s approach to jobs bill, and Rand Paul’s efforts toward vaccine hesitancy.
Anyone thinking there is a big boom coming after the pandemic, is not watching the news. It is not like after WWII when people were working together to rebuild and create a new country. There is no consensus on things being great other than on Wall Street.
The ten year yield figured that out 3 months ago.
The discrepancies in today’s employment report between the payroll and household surveys as well as no budge in the labor participation rate illustrate that all is not well. Commodity inflation may just be filling inventories rather than final sales.
I have not come across a birth / death rate comparison study for private companies vs public companies during the pandemic. But my out the windshield version review shows the carnage that Amazon and the internet have pushed down on private companies. Is this being reflected in government reports.
Joe Biden is being way to complacent in his approach, way to much empathy and not enough fear that he is not getting the job done.
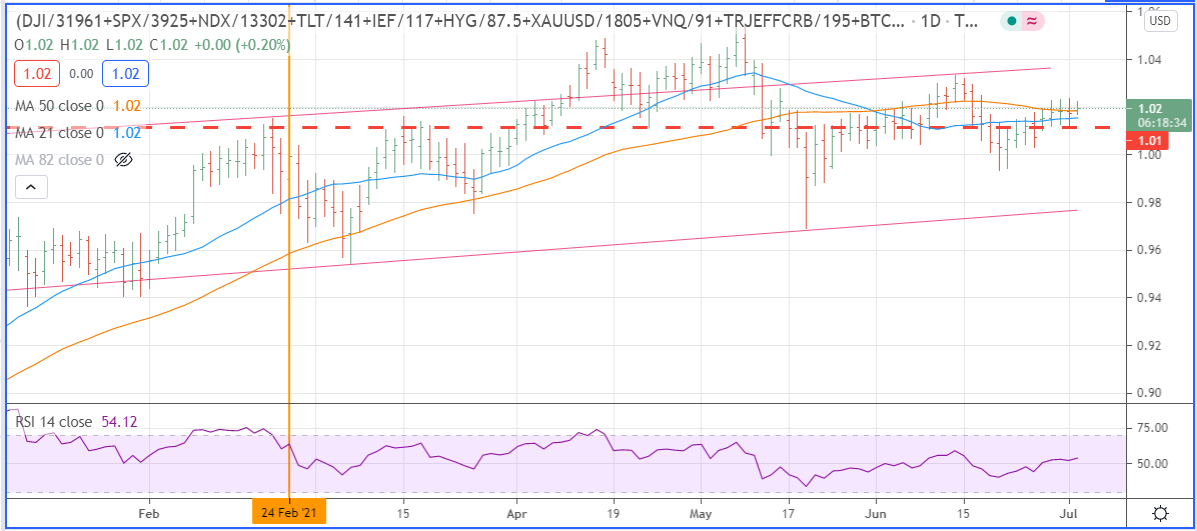
Here is an update of our Big Picture chart as of 9:00 AM CDT. Very little change being shown.
Update at 2:45 PM near the close.
To review, here is the list of key charts we follow and mention from time to time.
Market Picture Factors
- Composite Assets: DJI,SPX,NDX,TLT,IEF,HYG,GLD,VNQ,CRB,BTC
- Composite Five Factor: SPX,NDX,TLT,GLD,CRB
- Four Factor Stocks: SPX,NDX,DJI,RUT
- FANG Stocks: FB,AAPL,NFLX,GOOG
- FANG WB Stocks: SHOP,SPLK,DOCU,ZM,BYND,TTD,OKTA,ROKU,SQ,CRWD
- MAIN Street Retail: WMT,COST,HD,TGT,LOW,TSCO,AXP,FDX
- Infrastructure: CLF,CAT,XLE,FCX
- Travel and Entertainment: AAL,DAL,UAL,LUV,RCL,NCLH,CCL
- ARKK Futuristics: ARKK, ARKF, ARKG, ARKW, ARKQ
- MEME stocks: AMC, GME, BB, NOK, BBBY, KOSS, TLRY, MUIS, PETS, WEN
- Bitcoin: BTCUSD, ETHEREUM_XBT
Keeping in mind that we see this as an asset bubble with thing moving around inside the bubble, but the Bubble having made a double top in April and May (see composite chart) posted this morning.
So using the numbering of 1 to 11 on the charts, here is what they did today following the employment report. Basically the total asset index was up 0.41 % while the headline stuff, the Fang’s were up the most. On the downside were the travel and leisure stocks, the AARK stocks, the MEME stocks, and the Crypto stocks. In summary, more of the same.
Chart 1. +0.41 %
Chart 2. +0.65 %
Chart 3. +0.41%
Chart 4. +1.22%
Chart 5. +0.06%
Chart 6. +0.46 %
Chart 7. +0.49 %
Chart 8. -0.58 %
Chart 9. -0.65 %
Chart 10. -2.55 %
Chart 11. -1.29 %
Leave a Reply