The Day Everything Changed
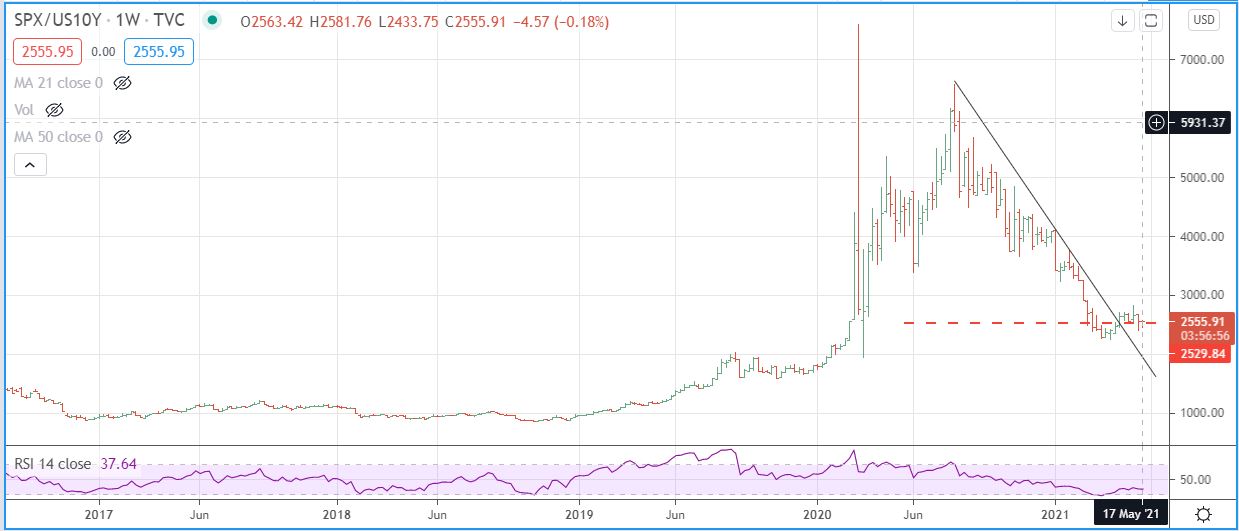
If you take a look back at our post on April15, you will see our Blow-Off comment, the day, when the downtrend line off the August 7, 2021 high of the S&P divided by the 10 year interest rate was breached.
The significance of this breach is that at that moment market players believed one of two things or maybe both things, 1) that the start of the much touted Tom Lee parabolic rally in stocks was beginning, or 2) that the 10 year interest rate was going to decline, or 3) both were going to occur.
But what really happened, nothing much. S&P closed at 4170 that day, today at 11:30 AM CDT it is at 4160. The 10 year interest rate closed at 1.555% that day, 1.625 % at the moment. See updated weekly chart here, it shows 6 weeks of sideways action.
To complete the overall picture today here are two charts updated that show two parts of the euphoria since election day and the reopening buzz recently,
First, here is the infrastructure trade which really started a week before the election, October 28, when it became apparent that Trump was going to lose and growth was going to return to the real economy. I am surprised at the multiple that the market added to that real growth potential, I thought that the speculation aspect would recede. It appears that this move topped out on May 10 and some elements of a decline from here are building, probably slowly until the 50 day average turns down, and then things will accelerate. This index includes 4 stocks, CLF, CAT, XLE, FCX.

Second, here is a chart for the consumer reopening trade which kicked off on March 4. It also topped on May 10. This index includes 9 stocks: WMT, COST, HD, TGT, LOW, BBY, TSCO, AXP, AMZN.

Leave a Reply