Land Speed Records
can run into headwinds.
Watching stocks for the last year is like going to Bonneville and watching attempts to set records on the salt flats. In most cases success is a function of having the car set up correctly for track conditions. When things change, like when “Mother Nature” intervenes, is when things get interesting. Cars get caught in soft sand or wind gusts and flip over or cartwheel. Usually the drivers survive, but sometimes not.
Today in the stock market, weather is on the horizon. Some of it could affect drought related food inflation, and some could affect interest rates. I have been trying to show that there is a significant risk, not Fed based, but market based, on interest rate issues.
Here are a few charts to make the picture:
First the S&P versus 10 year interest rate picture. As we outlined a few days ago, the market players were talking about a coming decline in interest rates and a new parabolic up move in stocks, As the chart shows here, nothing has happened since the breakout occurred. Things have kind of flattened out. Of course the FED will speak tomorrow, we are watching for how Powell will adjust the Land Speed Car. He might not know how, and his mechanics may be just a bunch of Harvard or Princeton trainees, with no practical experience.

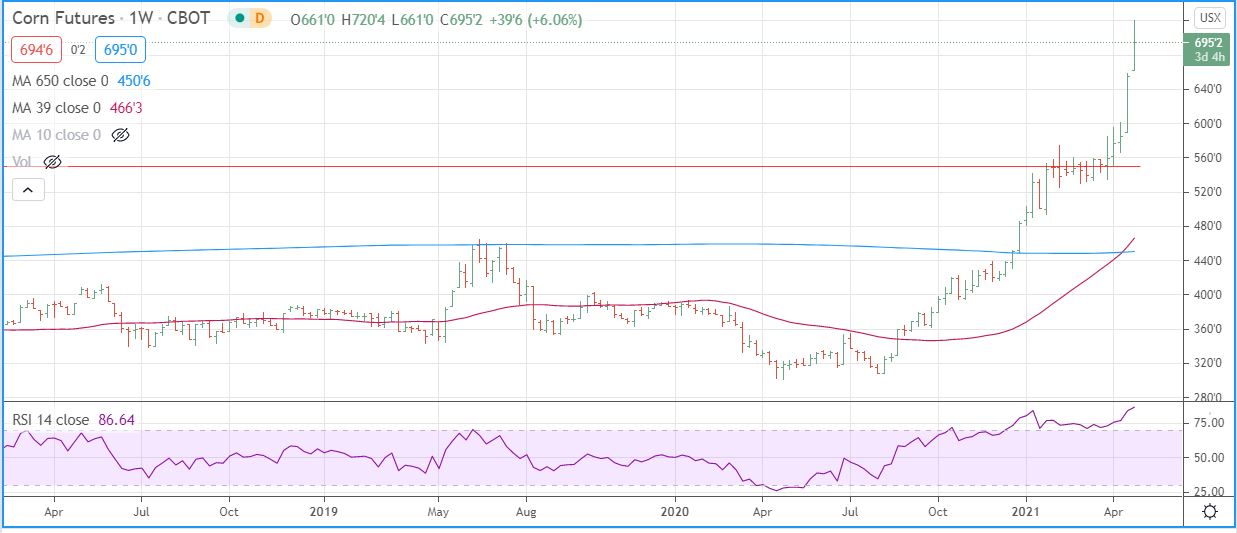
Another chart to look at is corn futures where drought issues are jumping to the forefront. I know our organic garden outside Chicago is very dry.
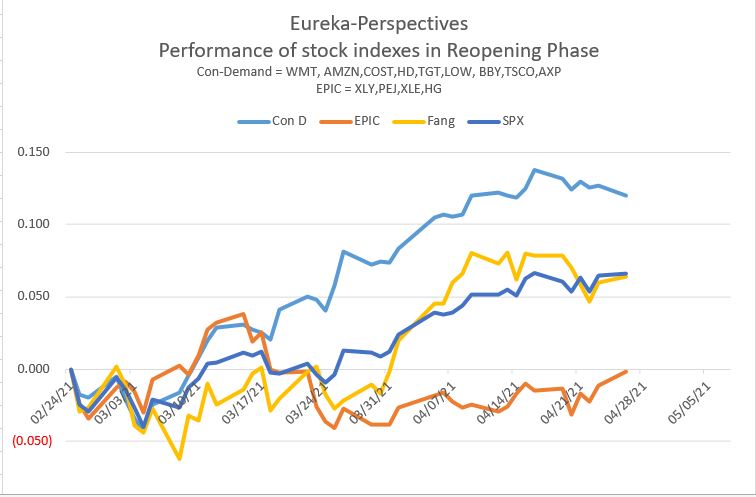
And lastly, in an attempt to get a handle on what I would call is the real re-opening picture. For me it involves tracking real companies that sell core items. In order to do this, I am tracking an index that I label Consumer Demand and includes WMT, AMZN, COST, HD, TGT, LOW, BBY, TSCO, AXP. I include American Express because it probably is less affected by internet purchases which have dominated things over the last year, and what I am looking for here is change in demand. Here is the chart, with comparisons to the S&P, FANG, and EPIC (epicenter stocks which supposedly are going to benefit from infrastructure investing). Start date for the chart is February 24, the date that CNBC indicated the “Reopening Play” was going to start. It is evident that the Consumer Demand stocks started off hot, but have cooled off some in the past few days.
Leave a Reply