Asset Bubble that morphed into a Interest Rate Bubble
Here is one of my favorite big picture charts that we have shared many times. The Market puzzle chart compares the S&P 500, Gold, Commodities, and the 2 year vs 30 year interest rate yield curve. (these are indexes based on values at the start of the market fracture point, January 26, 2018).
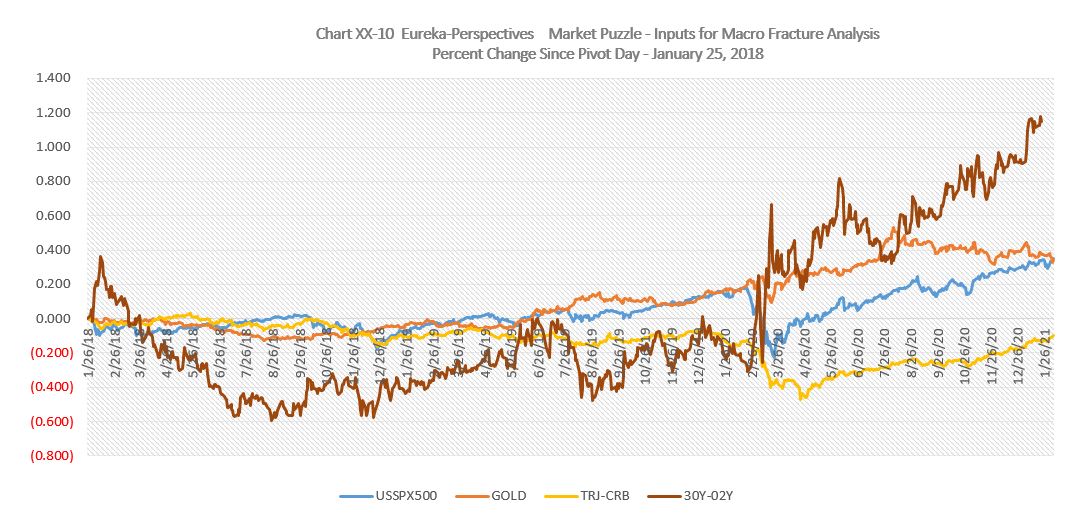
It is obvious what has had the biggest reaction, the yield curve as the FED holds down short term rates, and long term rates have sky rocketed. The COVID crash a year ago set things really in motion.
Also you will see how gold topped out as the yield curve took off on August 7, 2020. Probably most importantly, stocks and commodities have ignored the yield curve, and in fact the psychology of those two markets is subconsciously based on reflation.
And of course, my view is that reality will come in play as the economy basics, primarily the green infrastructure comes into play, as this will be long term investing with much lower P/E multiples.
Leave a Reply