A little like March 6th, but Not
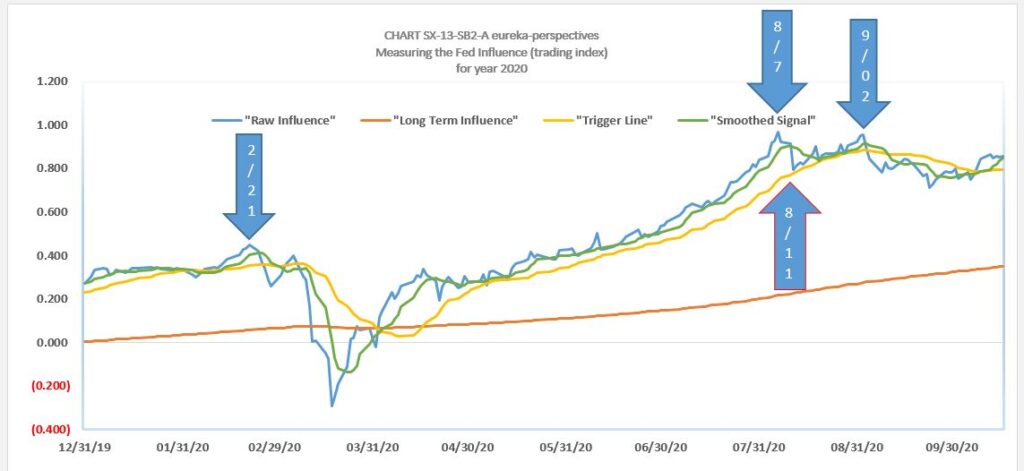
Here is our Fed Influence chart updated through10:00 AM today.
First, one has to keep in mind that this is an election market and that the people controlling the large piles of speculative cash are Trump supporters by and large. They still think he is going to win, that in spite of the polls, he will be able to steal the election through the Supreme Court.
So as we have said back in a number of posts over the past 3 months there will be a day when the light comes on, be patient. We all know the P/E ratios make this a market that does not have long-term upside potential.
What the chart shows is a rebound in the indicators, but well below the August 7th high. A longer term version of this chart illustrates to us that the big picture is getting more bearish on this bounce.
Some whats. March 6th ?
What we are referring to concerning March 6th, was this was the period when the market had made its high off the February 19th price and was struggling to rebound, right before a quick down leg. What I believe is different now is that this will not be a quick down leg that quickly makes a bottom, but a start to an extended downturn.
Leave a Reply