Outside the Box Ideas
Investor Lockup
At times like this when many investors are locked into inaction, it may be a good thing to look at the macro puzzle illustrated in the chart below.
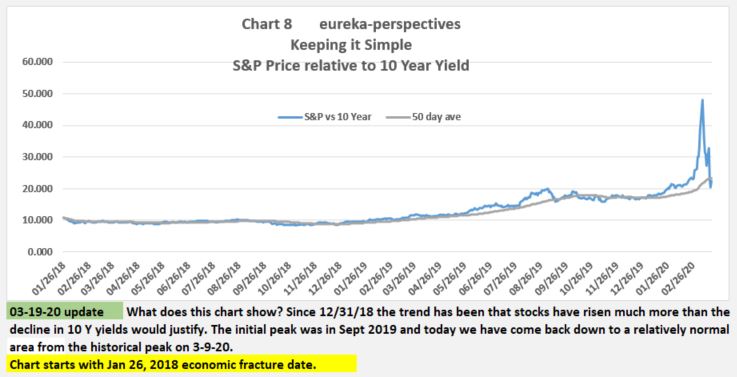
S&P and 10 year interest rate Relationship
This chart which begins on January 26, 2018, what we call the Economic Fracture date, shows how stocks were completely out of whack compared to interest rates.
This all started in December 2018, made a little peak in Sept 2019, and then went ballistic and crested on March 9, 2020. Today we are back down to close to trend.
This does not argue for the market going higher or lower, it is just that there are reasons why we are seeing a quiet time.
And then a little Outside the Box Thinking
If you are a contrarian you might want to look at what is expensive, T-Bonds in this case, and what is cheap, commodities (TRU-CRB index). Who has the guts
to sell bonds and buy commodities? Have to think about that piece of the puzzle.

Leave a Reply