Negative Rates are bad, the World is becoming Wiser….with update
Central Banks are Learning
Draghi’s difficulties at the ECB yesterday illustrated that low-low yields are not a good or easy answer.
The Powell Dilemma
Next Up is the September Federal Reserve Meeting and our guess is that they are going to reduce the Fed funds rate very slowly and probably not go below 1.25 % over the next 12 months regardless of how bad the economy gets.
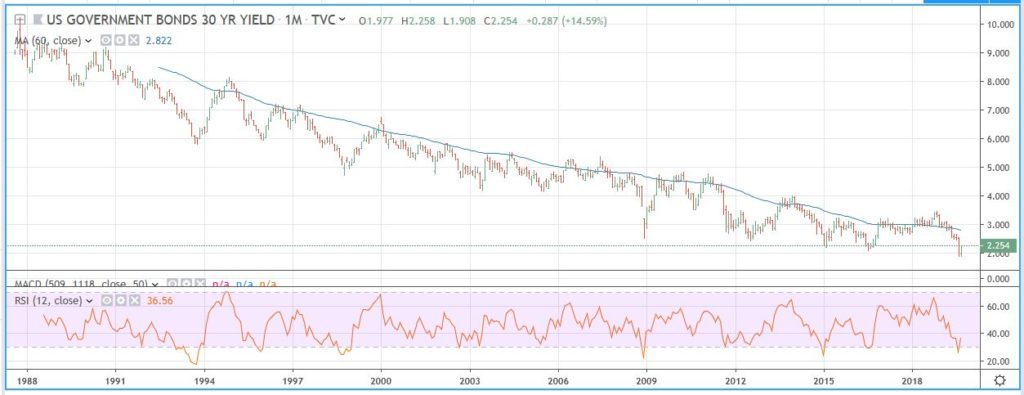
Here is a monthly chart on the 30 year bond from 1988 to date. Our view is that we more than likely on 8/28/19 saw the blow-off bottom in 30 year rates. The RSI (relative strength index) has made higher lows on the last three major declines, December 2008 at 22.73, January 2015 at 24.34, and August 2019 at 26.43.
Update at 12:00 Noon CDT
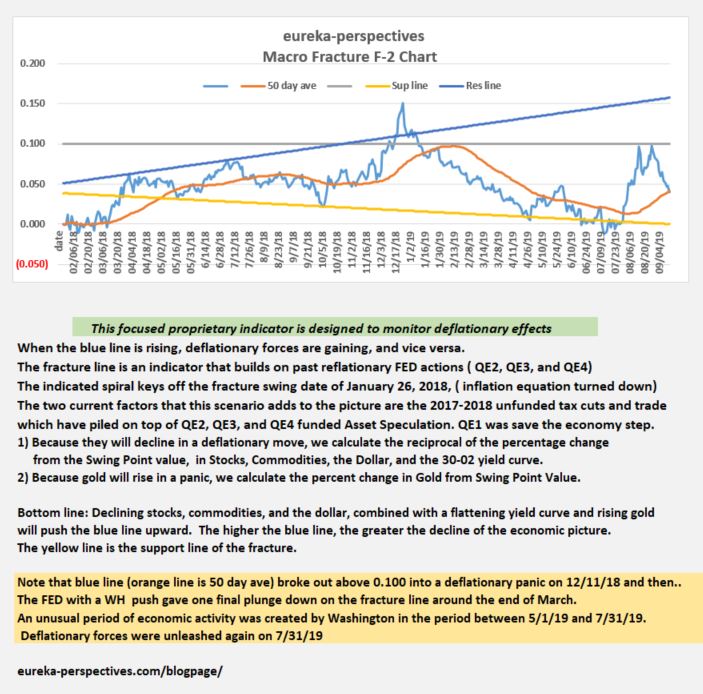
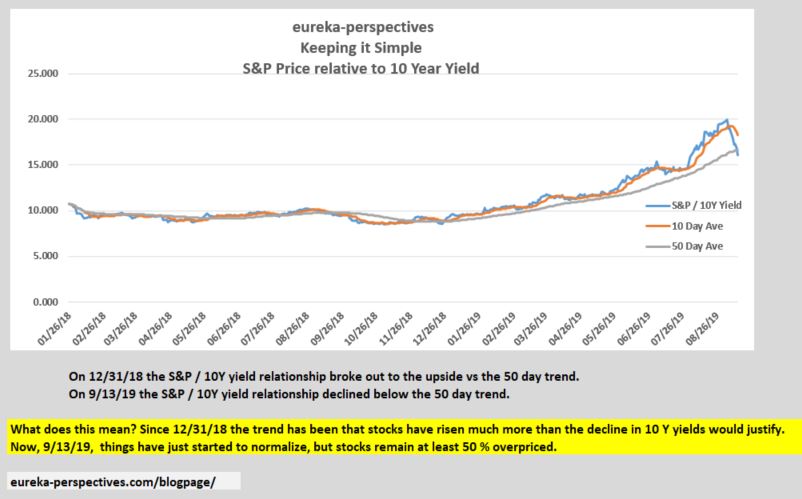
Just in case you are thinking we abandoned the Fracture Chart you will see todays chart and another chart called Keeping it Simple which addresses the effect of raw 10 year interest rates. The period when the yield curve was important has done its job of warning market players. You will see that the Fracture Chart is in a position to ratchet higher off the 50 day trend line.
Keeping it Simple
Leave a Reply