Watching the Cash Flows
We have ended six weeks of watching our two main tracking funds. As we mentioned Friday morning the chart patterns of the NAV charts were hinting that the EXTH chart was starting an upside breakaway compared to the ECT chart.
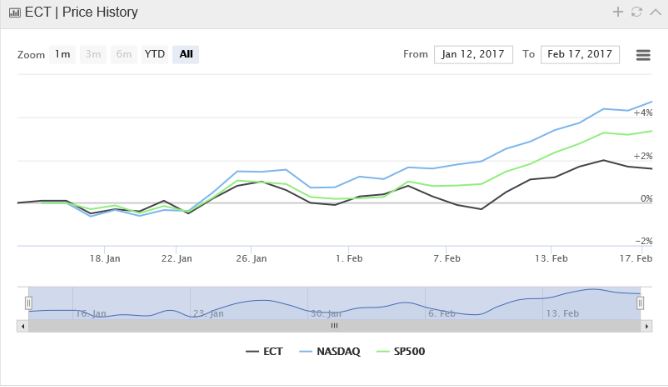
Here are updates on our two tracking funds through last Friday, 2/24/17.
ECT FUND, EUREKA CONSERVATIVE TREND,
This is the fund with a portfolio that our research indicates would profit with the success of the Trump Economic Program. It has a portfolio of 20 ETf’s that span, stocks, bonds, commodities, oil, precious metals and currencies. At the end of 6 weeks it is up 1.8 % and trailing the S&P 500.
EXTH Fund, EUREKA XT HEDGE,
This is the fund with a portfolio that our research indicates would profit from a failure of the new Trump Economic Program. It has a portfolio of 15 ETf’s that span, stocks, bonds, commodities, oil, precious metals and curriencies. At the end of 6 weeks it is up 3.4 % and is also trailing the S&P 500. (to date so far the high day is Feb 8)
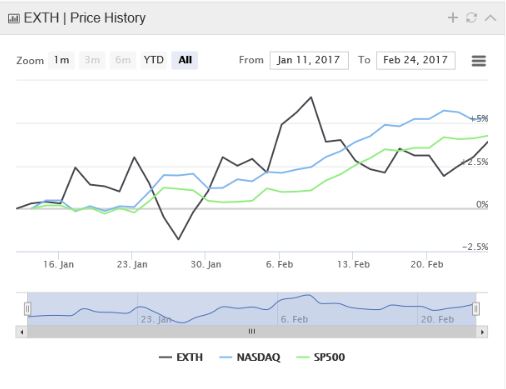
It is still to early to make solid comparisons. No doubt when the de-regulation and infrastructure stimulus programs pass Congress, there will be some knee jerk rally’s , but the long term results will be more meaningful.
One Trick Pony Investing
To date a simple position of long the NASDAQ index is providing the best performance. This I find very interesting and an indication of the risk profile in the current markets. What I am saying is that the interaction between equities, interest rates, and currency values is being ignored.
For information on our positions in the two Funds involved: email us at intrscop@mc.net
Leave a Reply