Retail Sales vs. Discretionary Sales
We like to track the Macro comparison charts of stock ETF indexes for the XLY (Discretionary) and XRT (Retail) to see if the economy is being led by hard sales (XRT) or soft sales (XLY).
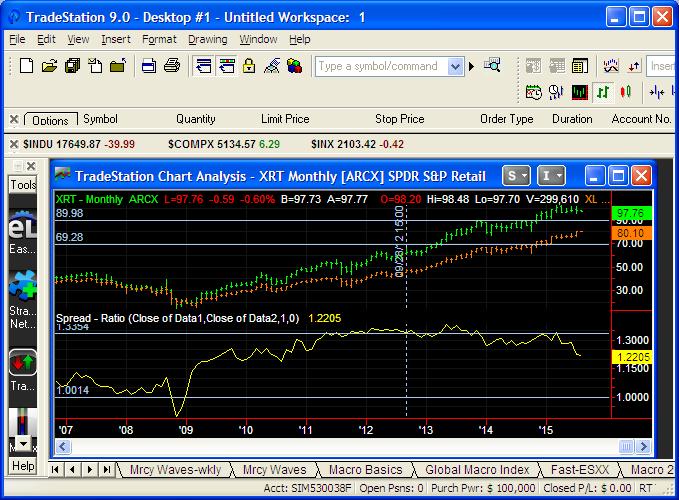
You will see in the chart below (vertical white line is start of QE3) that hard sales vs soft sales bottomed in October 2008 and peaked in May 2013. Recently the hard sales are starting a pronounced decline versus soft sales, not a sign of a strong economy.
Leave a Reply