Performance Review 10-15-2014
Performance Review 10-15-2014Last entry: 10-15.04
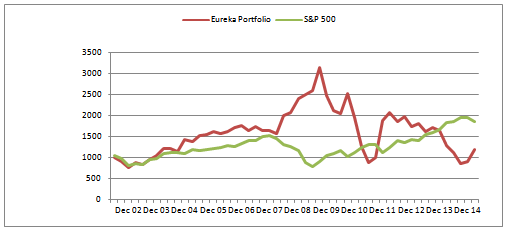
Below is a chart comparing the composite index of our 4 Marketocracy tracking funds compared to the S&P 500 Index. These funds — “ESF”, “EVF”, “EHF-1”, and “EHF-S” — carry positions based on our Macro View.
The Index puts a visual checkpoint value on the cumulative results of our market position actions based on market movement, the macro indicators we follow, and the effect of Federal Reserve and Political factors. One of the underlying premises of our approach is to show that a contrarian investment philosophy does exist, that buy and hold is not ones only choice. A second premise is that we want to show and evaluate FED money policy and its effect on market values.
During this 12 year period, and it actually was implemented in 1987 by Alan Greenspan as a reaction to the Crash of 87, a new era market philosophy has evolved. This philosophy is based on the belief that FED and government policy will always work to maximize short term gains, and that a MACRO view of solid money is talked about but never implemented.
The overall track record goes back to 2002 (before this website) and was for the first five years primarily a long gold defensive approach with some stocks. In 2005, leverage and long/short strategies that incorporated ETF’s were added to the mix. Figures are based on quarterly values.
For the majority of the 12 year period our index has been at a premium to the S&P. In two brief periods we have trailed the S&P, one currently where we have trailed the S&P for 6 quarters. Due to varying rates of leverage during this time (from 1:1 t0 8:1) our performance differential compared to the market has varied.
Our track record peaked in July 2009 when we saw that the financial crisis had passed and we had amassed a large amount of cash being short the market before and through the crash and then putting on long positions in the three months before the March 2009 market bottom.
At the end of the initial five month rally after the market low we moved out of our long positions and moved into a mix of trading positions and modest short positions. This trading direction was based on our view that a lot of Fiscal work needed to be done to build a solid base for economic prosperity. That work was never done and five years later still waits to be implemented as the world economic picture struggles with the underlying artificial props.
While our view that deflation was the biggest risk has proven correct in a lot of areas, it has not been true in paper assets. This is no doubt because the big pools of funny money feel safe pushing an area where liquidity is high and there are few restraints to inflated valuations. It probably should be kept in mind that this 17.6 portion (2000 t0 2017) of the 72 year Long Economic Cycle still has a little over three years before it plays out. That means that there is still a lot to be seen.
Our performance has been gaining on the S&P since the end of the second quarter on June 30, 2014. At the moment our primary position is short stock ETF’s at around a leverage level of 6:1, we let short leverage increase over the past four years, starting at around 2:1 and increasing as the market valuations became more and more stretched. We also have small positions in Short commodity ETF’s and Long Dollar ETF’s. See performance chart here.
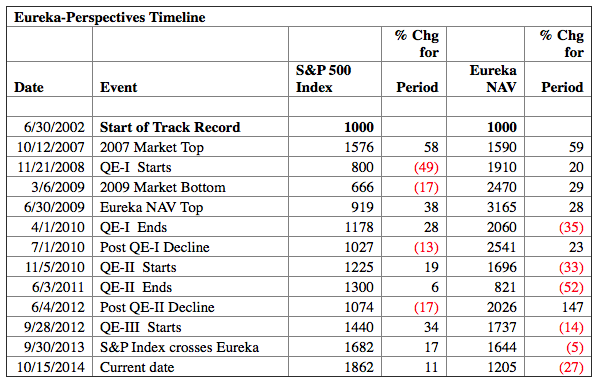
To provide you a little more feel of the data see Timeline Table below:
Leave a Reply