Where are Investors Now?
I talk a lot about the beginning of the market bottom between May 11 and May16, the high of wholesale commodity prices basis the CRB index on June 6, and the retest of the market bottom on October 14. At this point we are out a little more than a month since that retest.
So what does an analysis of the market point to investor’s thinking now, via their actions and where they are putting their money?
To do this I have run a screen through the various market sectors in order to evaluate sector strength as of last Friday, November 18. After running that screen I have come up with four categories based on our ranking system.
- Category One is what I call sectors where investors seem to feel safe and attracted at this point. This area consists of industrials, energy, health care, pharma, plus value and Dividend stocks. The energy component is worth watching as oil prices are not acting well although it is interesting that few traders are pressing the short oil ETF, SCO.
- The second area includes sectors that are showing signs of having the strength to show out of the bottom area. These sectors include: small cap Russell stocks, the transports, infrastructure, biotech, solar, consumer staples, retail, and banks.
- The third category is what I would call “holding in place” waiting for good news. Interestingly this is the biggest area in terms of number of sectors, and it includes the S&P 500 and Nasdaq 100. Also in this category are the Fang stocks, 20Yr bonds, technology. EV, China, software, consumer discretionary.
- The fourth area is what I would call “investors avoiding at all cost”, these are basically obvious, Crypto, commodities, and short oil.
As to my market conviction at the moment, I see a sharp rally out of the bottom with the stocks in the Category three area being the most explosive. If I had to pick a time for this to happen, I would say the Monday after thanksgiving has a good probability.
And, moving on to Crypto..
Longtime readers of this blog know that I have taken a hands-off approach to Crypto and Bitcoin, kind of viewing it as something between a Ponzi scheme and something unexplainable. But, it has held on, albeit with real problems this year. With the huge losses taken by holders of Bitcoin It probably has had more effect on the markets the past few months than the FED balance sheet unwinding.
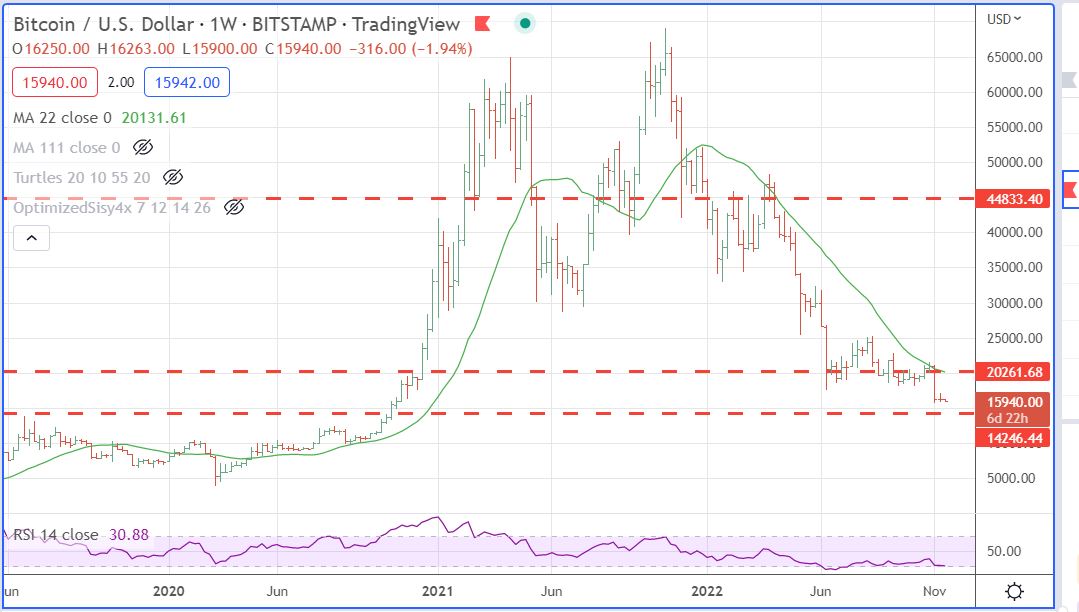
I do find it interesting to watch as a chart game. So here are two charts, one using monthly data in order to see the big picture and support and resistance levels and one using weekly data to drill down a bit. Daily data is kind of meaningless on something this unwieldly, a market dominated by amateur traders.
Two levels jump out at me based on the monthly data, the 2018 high of 19,666, and the 2019 high of 13,880. I would hazard a guess that somewhere between those two levels a bottom will be found this week. Market at this moment on Sunday night is 15,940.
Here are the two charts:

Leave a Reply