Adding some History to the Big Picture
Today we will show the same 10 asset bubble picture as yesterday but go back in time in order to allow a review of how we got here, and more importantly why this is the end of the story.
First, here is the chart using weekly data rather than daily. This allows one to go back and see some recent history of how this all unfolded, (keeping in mind that the phenomena that we are seeing started some 40 years ago with trickle down and was accelerated in October 2011 with the FED’s QE2). Charted updated at 10:00 AM CDT 6/24/21.
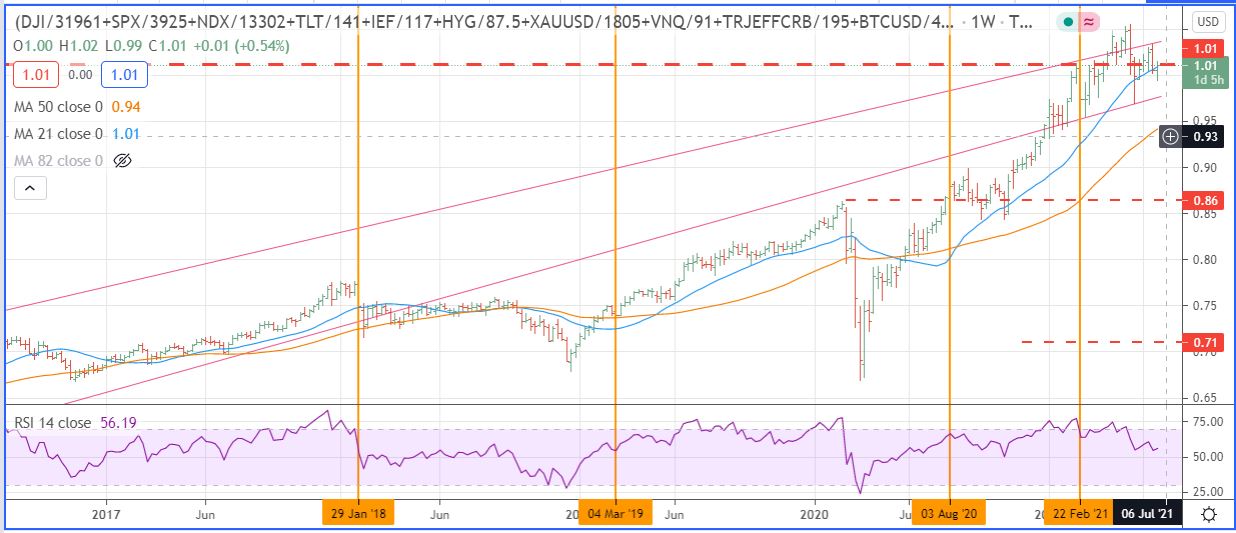
The yellow vertical time line points signify the following.
- January 28, 2018, this is the date the markets realized the Trump Tariff and Corporate Tax Cut were not going to bring real growth.
- March 2019, this is the period when Trump pressured the FED to start lowering rates because his economic program was stalling.
- August 7, 2020, this is the date that the market came to the realization that the stimulus was out of control and the 10 year interest rate started rising as a consequence.
- February 24, 2021, this is the date that the markets came to the conclusion that stimulus and hope were way ahead of anything real in terms of economic growth. !0 year interest rates started a modest retreat from that time.
So the Bubble is pumped up. Total assets topped on May 10th 2021. Now the Tom Lee and CNBC Halftime crowd are pushing up the stock side of the equation as this all comes to an end. The other seven pieces of the equation have essentially dropped off while the total picture is heading towards a liquidity crunch as rate of increase on FED stimulus is reaching maturation.
My much talked about detail on the other seven parts of the equation are still coming, but you have the meat of the story here. You can go back to the 6/17/21 post to see charts of those aspects of the equation.
For those of you that follow Swing Pattern analysis, it is interesting that the index used in the chart had a March 2020 low at 0.67 and rose to 0.86 on August 7, 2020 (the COVID decline and rise period), a 0.19 change. Now we have seen the index top at 1.06 on May 10, 2021, a change of 0.20. Seems like that could be enough.
Detail UPDATE ON 10 Factor Basket at 1:30 PM CDT
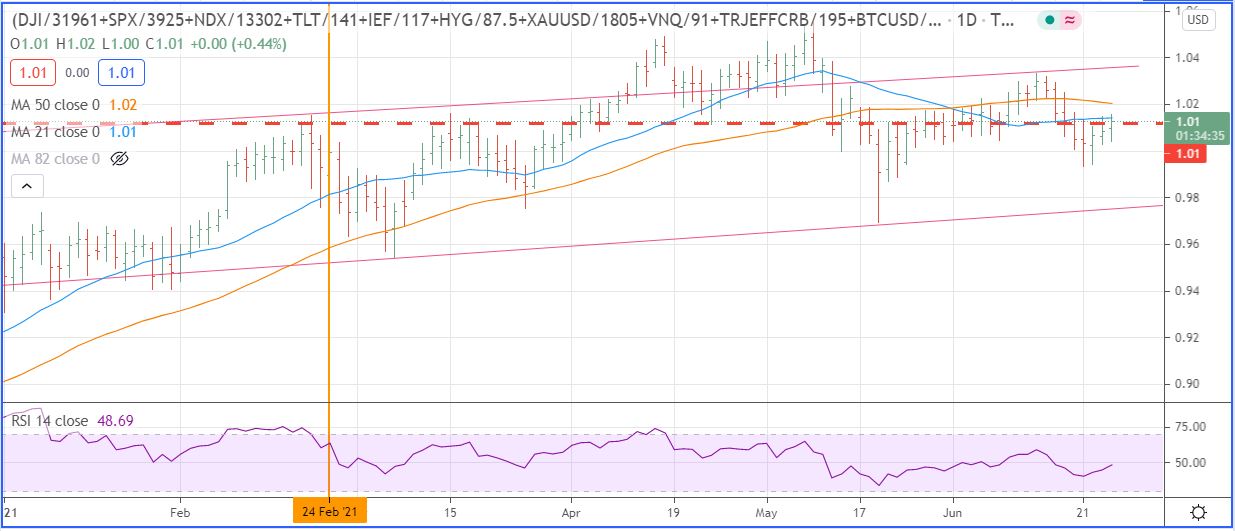
Here is the short term daily version of the weekly chart posted earlier today.
As the new abbreviated infrastructure bill is being touted as done we have seen a small increase in the index from the recent low of 99.4 on Monday to 1.01 at the moment. Unfortunately the bill misses the point of creating jobs and having the bill paid for, we have to stop sending out money with every crisis and get back to real growth, but who will fight for that?
Leave a Reply