Who is in Charge Now, Dollar vs. FED
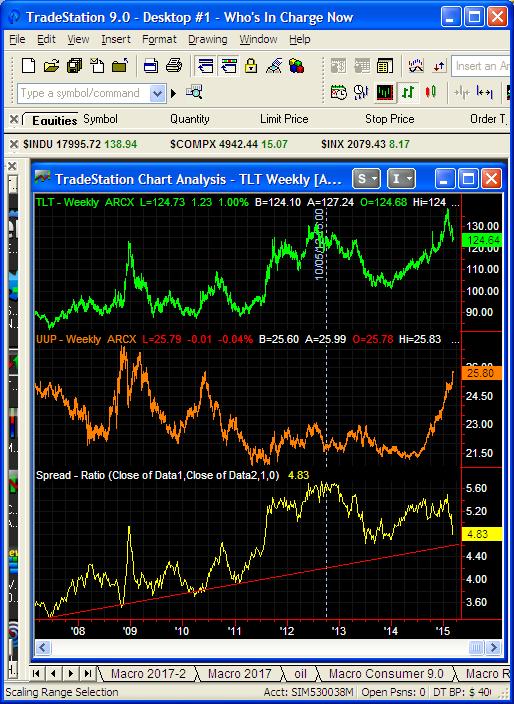
Little did Bernanke know what he was creating when he setup QE III in September 2012. Now we are getting a glimpse of how this plays out. Today we are adding the most important chart to the series we posted yesterday, the dollar/bond relationship chart. It may be surprising to some that the max ratio differential between T-Bonds and the dollar occurred just as QE III commenced. A number of things developed out of this arrangement.
1) T-Bonds went up
2) Paper assets went up
3) And then eventually the dollar took off
4) And then oil and commodities tanked
4) And then the Bernanke global copy cats jumped on board
5) An then T-Bonds topped out and long term interest rates started up
6) And then….
While all this is happening stock market investors are slobbering over Apple stock, it is a great world in which we live.
Leave a Reply