What if Oil Averages $ 50 a Barrel Over the Next Three Years
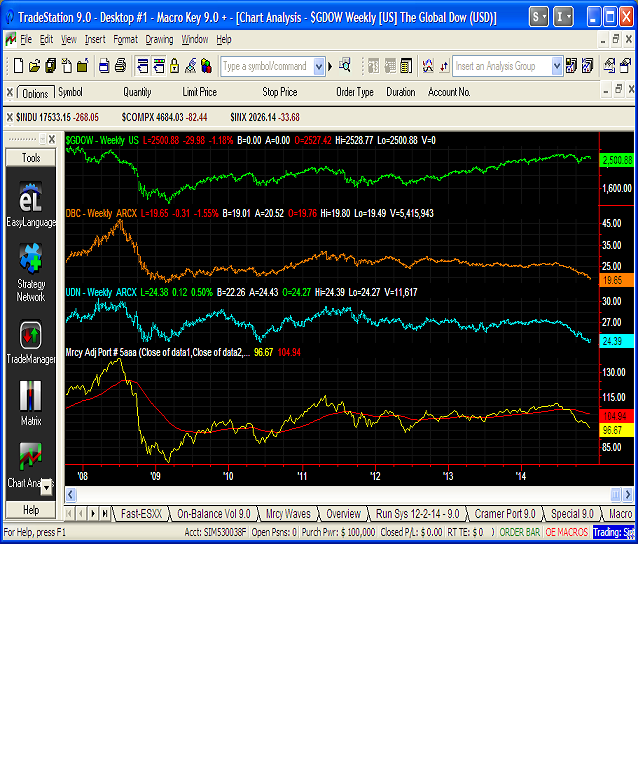
One Macro chart that for me is the best picture of the global economic environment is the Macro Key chart below. Three things pop out when one looks at this chart:
1) one is that Global stock averages have not made new highs since 2008;
2) Another is that commodities are at this time down 48 percent based on the 2008 high.
3) A strong dollar is Macro positive for the US and Macro negative to the world, as such I watch a short dollar etf as the third component in this chart.
The index created from these three data streams was high at 139 in July 2008, low at 76 in March 2009, bounced to 116 in April 2011 and currently is at 97. One thing that is significant to me is that the FED’s QE3 did not provide a sustainable bounce. I would not be surprised to see the 2009 low breached over the next three years.
For me it looks like the deflationary forces will eventually move through the economies of the world. The blog title today points to how investors may want to view the coming events relative to their investment portfolio. Commodities were first to deflate, oil was second, we still have to see the effect on stock market assets, gold, and high end real estate.
Most market participants feel safe being long US stocks until the FED signals a rate rise. For me, until the FED stops rolling over the Balance Sheet and actually starts drawing it down, interest rates will remain low and probably for a while after as the finals straw of the Bernanke experiment plays out in a deflationary rout.
Leave a Reply